New Relic is an exceedingly potent supervisory instrument that enables the monitoring of application, server, and database performance. Synthetic monitoring for new relics is one of its principal capabilities, empowering users to mimic human interactions with web applications and monitor performance in real-time. With Synthetics, identify and troubleshoot problems prior to their escalation, and enhance the experience of end-users.
In this post, we'll look at New Relic monitoring functionality, data types that may be tracked, and APM (Application Performance Monitoring) functionality. Also included are instructions on how to set up New Relic monitoring and a step-by-step guide to setting up synthetics monitoring for new relic users.
 |
| photo by Furknsaglam |
Understanding Synthetics Monitoring
Synthetics monitoring involves simulating user activity to test the performance of online services. There are several types of synthetic monitors, including browser monitors, API monitors, and scripted monitors. Each type of monitor simulates a different aspect of user activity. For example, browser monitors simulate user interactions with web pages, while API monitors simulate user interactions with web services.
Why use Synthetics Monitoring in New Relic?
Synthetic monitoring offers several benefits to businesses that rely on software and online services. Firstly, it helps businesses to identify and resolve issues before they impact users. This reduces the risk of downtime, which can be costly in terms of lost revenue and reputation. Secondly, synthetics monitoring helps businesses to improve the user experience by identifying and resolving performance issues. Finally, synthetics monitoring helps businesses to stay ahead of the competition by ensuring that their services are always available and performing well.
Synthetics monitoring provides several benefits to application owners, including:
- Proactive monitoring of application performance and uptime
- Improved visibility into the end-user experience
- Early detection of issues before they affect end-users
- Faster time to resolution for issues
- Reduced downtime and associated costs
- Improved customer satisfaction
Prerequisites for Setting up Synthetics Monitoring
Before you can start using Synthetics monitoring, you'll need to:
- Have a New Relic account
- Have access to Synthetics within your New Relic account
- Have a web application to monitor
- Be familiar with the basics of web development and HTTP requests
- Have an understanding of what you want to monitor in your application
Step-by-Step Guide to Setting up Synthetics Monitoring
Setting Up Synthetics Monitoring in New Relic
New Relic is an excellent platform for synthetics monitoring. Here's how to set it up:
- Create a New Relic account: The first step is to create a New Relic account. This is a straightforward cycle that includes giving some fundamental data about your business.
- Add the Synthetics Monitor feature: Once you've created a New Relic account, the next step is to add the Synthetics Monitor feature. This is done by navigating to the Synthetics Monitor section of the New Relic dashboard and clicking on the "Add" button.
- Create your first synthetic monitor: The final step is to create your first synthetic monitor. This is done by selecting the type of monitor you want to create and configuring the settings.
Creating a Monitor
- Log in to your New Relic account.
- From the main menu, select 'Synthetics' > 'Monitors'.
- Click on the 'New monitor' button.
- Select the type of monitor you want to create (Ping, Simple Browser, or Scripted Browser).
- Enter a name for your monitor and a URL to monitor.
- Configure the monitoring settings (frequency, locations, etc.).
- Click on the 'Create' button to create the monitor.
Defining a Ping Test
- In the 'Monitors' tab, click on the name of the monitor you want to configure.
- Click on the 'Edit' button.
- Select the 'Ping' tab.
- Configure the monitoring settings (e.g., IP address, timeout).
- Click on the 'Save' button to save the settings.
Defining a Simple Browser Test
- In the 'Monitors' tab, click on the name of the monitor you want to configure.
- Click on the 'Edit' button.
- Select the 'Simple Browser' tab.
- Configure the monitoring settings (e.g., browser type, location).
- Define the user actions you want to simulate (e.g., page load, button click).
- Configure the validation settings (e.g., response time, HTTP status code).
- Click on the 'Save' button to save the settings.
Defining a Scripted Browser Test
- In the 'Monitors' tab, click on the name of the monitor you want to configure.
- Click on the 'Edit' button.
- Select the 'Scripted Browser' tab.
- Write your script to simulate user actions and interactions.
- Configure the validation settings (e.g., response time, HTTP status code).
- Click on the 'Save' button to save the settings.
Configuring Synthetics Monitoring in New Relic
Once you've set up synthetics monitoring in New Relic, it's important to configure it correctly. Here are some tips:
- Configure monitor frequency and location: Set the frequency and location of your synthetic monitors to ensure that you're monitoring your services effectively.
- Set up monitor notifications: Set up notifications to alert you when there are issues with your synthetic monitors.
- Configure advanced settings: Configure some of the more advanced settings to fine-tune your synthetics monitoring.
Analyzing and Optimizing Synthetics Monitoring
Once your synthetics monitoring is up and running, it's important to analyze the results and optimize your configurations. Here's how:
- Check that your monitor settings are correct, including the URL, frequency, and validation criteria.
- Ensure that your web application is accessible and responsive.
- Check that your New Relic account and Synthetics subscription are up-to-date.
- Review the Synthetics troubleshooting documentation and reach out to New Relic support if necessary.
- Understand synthetic monitor results: Learn how to interpret the results of your synthetic monitors to identify issues and performance bottlenecks.
- Identify and troubleshoot errors: Use the results of your synthetic monitors to identify and troubleshoot errors.
- Optimize monitor configurations: Use the results of your synthetic monitors to optimize your configurations and improve the effectiveness of your synthetic monitoring.
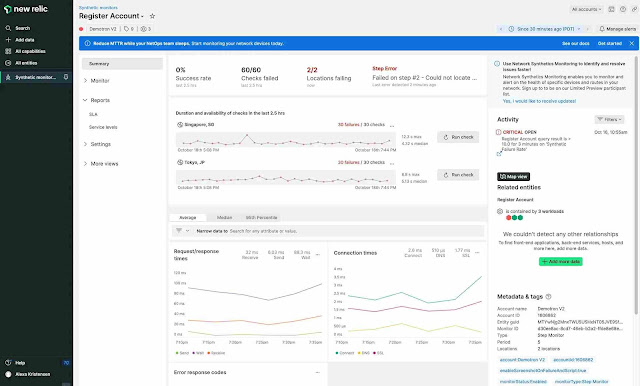
Summary Page View of Synthetics Monitoring.
Integrating Synthetics Monitoring with Other New Relic Features
New Relic offers several features that can be used in conjunction with synthetics monitoring. Here are some examples:
- Using Insights with synthetic monitoring: Use Insights to analyze the results of your synthetic monitors and gain insights into performance issues.
- Integrating APM with synthetic monitoring: Use APM to gain deeper insights into the performance of your applications and services.
- Using dashboards with synthetic monitoring: Create dashboards to visualize the results of your synthetic monitors and track performance metrics over time.
Best Practices for Synthetics Monitoring in New Relic
Here are some best practices for mastering synthetic monitoring in New Relic:
- Start with simple monitors: Start with simple monitors and gradually add complexity as you become more familiar with the platform.
- Use the correct type of monitor: Use the correct type of monitor for the task at hand. For example, use browser monitors to simulate user interactions with web pages and API monitors to simulate user interactions with web services.
- Monitor from different locations: Monitor your services from different locations to ensure that you're capturing a representative sample of user activity.
- Monitor at different times of day: Monitor your services at different times of day to ensure that you're capturing a representative sample of user activity.
- Use scripting to add complexity: Use scripting to add complexity to your synthetic monitors and simulate more realistic user activity.
Tips for Successful Synthetics Monitoring
- Define clear objectives for your monitoring, and monitor only what's important to your business.
- Configure your monitors to run from multiple locations to ensure broad coverage.
- Use validation to ensure that the monitored application is performing as expected.
- Avoid creating too many monitors, as this can lead to performance issues.
- Regularly review your monitoring results to identify trends and issues.
Conclusion
Synthetic monitoring is a powerful technique for testing the performance of online services. With New Relic, setting up and configuring synthetics monitoring is a straightforward process. By following the steps outlined in this article, you'll be well on your way to mastering synthetics monitoring in New Relic. Remember to start with simple monitors and gradually add complexity, monitor from different locations and at different times of day, and use scripting to simulate more realistic user activity.
FAQs
Q1. How much does Synthetics monitoring cost in New Relic?
Ans: Synthetics monitoring is included with most New Relic accounts. Be that as it may, there might be extra expenses related to utilizing different screens or running screens from numerous areas.
Q2. Can Synthetics monitoring be used for mobile applications?
Ans: Yes, Synthetics monitoring can be used to monitor the performance of mobile applications. However, additional configuration may be required.
Q3. Can I set up alerts based on Synthetics monitoring results?
Ans: Yes, you can configure alerts in New Relic based on Synthetics monitoring results. This can assist you with rapidly recognizing and answering issues.
Q4. Is it possible to share Synthetics monitoring results with other team members?
Ans: Yes, you can share Synthetics monitoring results with other team members by granting them access to your New Relic account or exporting the results to a third-party tool.
Q5. How often should I run Synthetics monitoring?
Ans: The frequency of Synthetics monitoring depends on the criticality of the monitored application and the resources available for monitoring. As a rule, it's smart to screen to recognize issues rapidly without overburdening the framework.
Q6. How do I disable Synthetic monitoring in New Relic?
Ans: To disable Synthetic monitoring in New Relic, go to the Synthetics Monitor settings and click the "Disable" button. You can likewise handicap individual screens by choosing them in the dashboard and tapping the "disable" button.
Q7. How does New Relic monitoring work?
Ans: New Relic monitoring works by collecting data from your applications and services using agents and integrations. These agents and integrations track various metrics related to the performance of your applications and services, such as response times, error rates, transaction traces, and database performance. The gathered information is then examined and imagined in New Artifact's dashboard, furnishing you with a reasonable comprehension of how your framework is performing.
Q8. What types of data can be monitored with New Relic?
Ans: With New Relic, you can monitor a wide range of data related to your applications and services, such as web transactions, mobile application performance, server metrics, browser performance, and infrastructure monitoring.
Read More...
- What Criteria Is Used When Deciding on a Robot Program? (Click here...)
- Tex9.net Comes Next: Introducing And Trending News-2023. (Click here...)
- Blind Billionaires: Financial Challenges with Strategic Money Management. (Click here...)


